Dynamic thermal simulation (DTS) has come into its own in recent years. Popular with a number of environmental labels, such as Sustainable Buildings, HQE and BREEAM, this method not only makes it possible to approach actual consumption as closely as possible, but also to design the building envelope and systems to improve summer comfort.
However, STD remains a model. It is not a guarantee of impeccable thermal comfort in reality.
The tools available include TRNSYS and IESVE, but Pleiades’ STD COMFIE module is recognised as the tool most commonly used by design offices in France.
In this article, we will focus on this STD software from d’Izuba énergies to show how to get the best out of it, specifically in relation to ceiling fan and summer comfort issues.
The visuals are from the October 2023 update. Older versions of the software therefore look different.
Before reading the text below, we strongly suggest that you first read our publication: “Summer thermal comfort and ceiling fans: can we measure the improvement?”
It should be noted that this article is not intended to be an alternative tutorial to the Pleiades software publisher’s documentation, but rather to provide information specific to ceiling fans in an STD context.
Finally, we are seeing an increase in the use of Computational Fluid Dynamics (CFD) modelling, which makes it possible to simulate air speeds with a high degree of accuracy. This technique, which is distinct from STD, is currently fairly expensive. It is reserved for a minority of projects and is not covered in the following publication.
Comfort parameters: what input data?
Overall data
The diagram below summarises the input data for the comfort analysis, which we will examine in blocks.
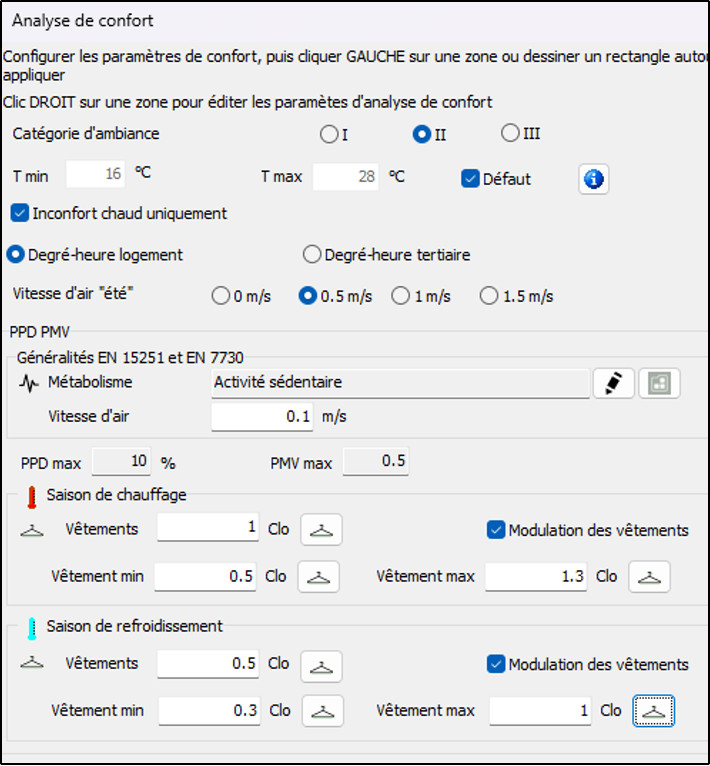
Figure 1: Overview of comfort parameters
Ambience category
Figure 2: Environment category block
Pleiades is based on standards EN 15251 (Criteria for indoor environments) and EN 7730 (Ergonomics of thermal environments)[i]. The tool first asks you to choose an environment category.
The choice of room category determines the maximum PPD and PMV level. These concepts for assessing thermal comfort are described in the article recommended in the introduction.
Level I of the ambience category is the most demanding: the percentage of dissatisfied customers is set at 6%. This rises to 10% for level II and 15% for level III.
Level II is generally recommended.
Comfort limit temperatures

You can then enter a minimum and maximum comfort temperature to be used for the zone. 28°C is the usual high value. Low discomforts can be ignored by ticking the “Warm discomfort only” box.
Note that the comfort limits can be redefined in the summary tables of comfort results after the simulation.
DH indicator calculation method
The DH indicator, taken from the RE 2020 regulation, is also available in STD. This indicator, calculated in the same way as in the regulations, assesses the difference between the building temperature and a comfort temperature (a temperature adapted according to the temperatures of the previous days, varying between 26 and 28°C).
Its value represents the cumulative weighted discomfort over the year.
The calculation method differs between tertiary and residential buildings. For the latter, adaptive comfort at night is not taken into account, and the temperature limit remains at 26°C.
The DH indicator is used to value ceiling fans. In the presence of air circulation, the high comfort limit is automatically adjusted to take account of the ceiling fan. The Tmax temperature should therefore be left unchanged.
The air speed is taken from the “Summer air speed” entered at zone level. It can be modified directly in the table in figure 12 below to recalculate the indicators.
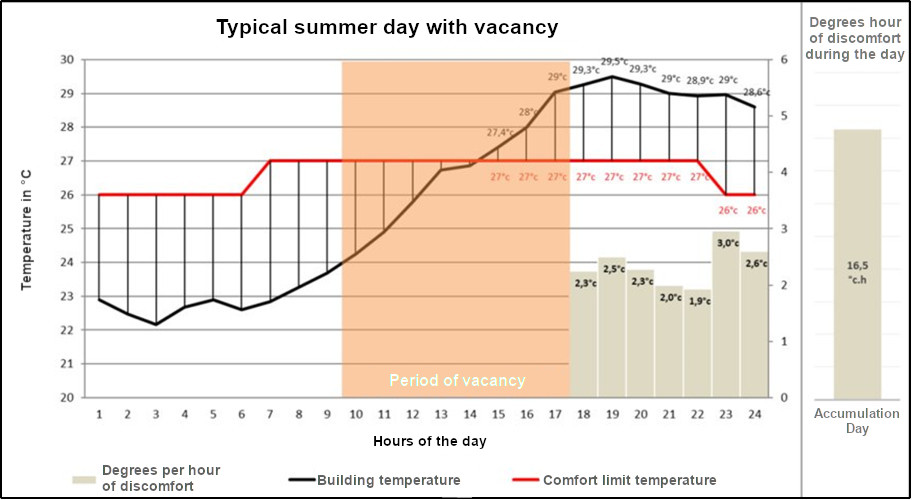
“Summer” air speed
This air velocity is used to assess DH indicators in summer, as well as acceptable indoor temperature in non-air-conditioned areas (EN 15251). The tool can only be used in steps of 0.5 m/s.
Air speed varies according to the type of ceiling fan used (bladed or bladeless) and the occupant’s location in a given volume.
It is at this stage that air speed visuals show their relevance.
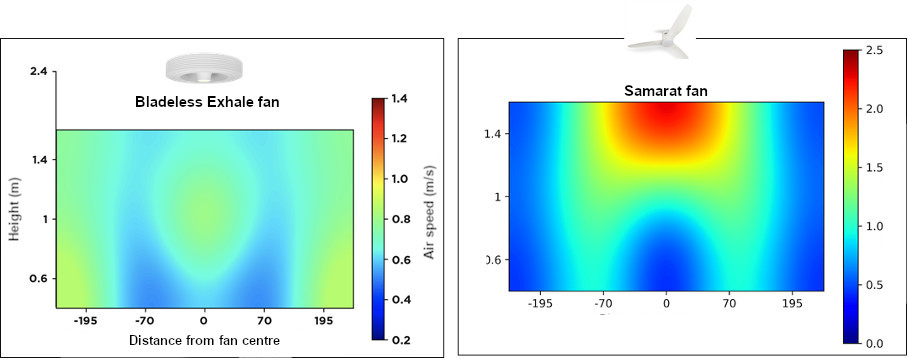
To make the best use of the above representations, here are the approximate heights of the different parts of the human body in a seated position:
| Body part | Head | Bust | Belt | Dowels |
|---|---|---|---|---|
| Height (m) | 1,40 | 1,00 | 0,60 | 0,10 |
It should also be noted that air velocity is reduced by the presence of furniture. For example, during a measurement campaign on an educational site, we observed a 25% reduction in average air speed in the presence of school furniture, which gives an idea of the effect.
The proximity of the air blower, the presence of furniture and the position of users are all variable factors, so the air speed is not uniform throughout the zone.
We therefore need to take an approximation of speed that is valid for most occupants.
It is air velocity at maximum flow rate that should be entered under the heading “air velocity above 25°C”. However, our experience leads us to consider that a velocity greater than 1 m/s seems very optimistic outside laboratories.
Furthermore, as the BRASSE programme[ii], has shown, the beneficial impact of air speed results in a cooling effect of 1.5°C from 0.2 m/s.
Good layout[iii], is essential, with a sufficient density of ceiling fans to ensure that all occupants can obtain the air speed they require.
Here are our measurements of average air speed, at 5 points, at 3 different heights (head, chest, waist), in a closed room with no furniture.
| Measured air speed (m/s) | Closed volume (bedroom), layout 1 brewer/12 m² Room without furniture |
|---|---|
| Exhale (without blades) | 0,65 |
| Samarat (three-piece monobloc) | 0,80 |
Metabolism and air speed

Metabolism (MET) corresponds to the activity of the occupants: the range of choices is shown in Figure 9, and each level of metabolic activity corresponds to a value. For an office worker, “resting seated” is chosen, MET=1. For a teacher, we might choose “light standing activity”, MET=1.6. The increase in MET value reflects the energy expenditure of the body, which will therefore need to cool down.
For example, this is the purpose of a ceiling fan specifically for teachers, installed vertically above their workstations.
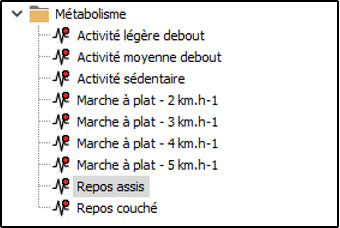
The air speed is also entered in this general section. This is an annual base value, not the summer air speed, which is why we recommend a value between 0 and 0.1.
In the heating season, the benefits of ceiling fans in terms of destratification and energy savings are not taken into account by Pleiades. For this reason, we do not deal with the winter season, and concentrate on the summer season.
Clothing for calculating PPD/PMV indicators
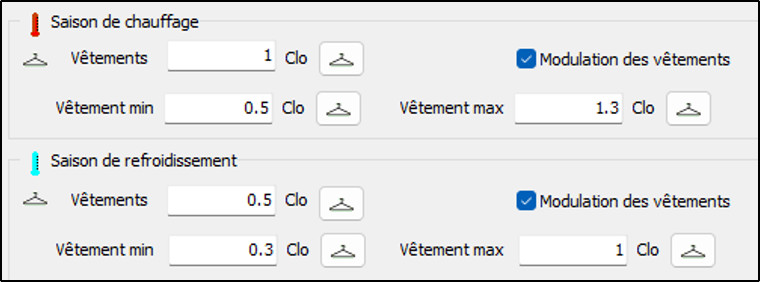
The value to be adopted for clothing should be based on the usual practices in the premises concerned. It goes without saying that the lighter you dress, the easier it is to withstand high temperatures without resorting to air conditioning.
It is possible to refine things further by playing with the modulation of clothing for the same zone, i.e. occupants can add or remove layers of clothing within the same season.

Thermal comfort diagrams
Once these parameters have been set, you need to run the calculations, then choose “Comfort” from the drop-down menu at the top of the results summary.

This summary gives access to all the comfort indicators.
Hours of discomfort
The table above shows, zone by zone, the hours of discomfort and the percentage of discomfort time below the low limit and above the high limit. These limits can be modified directly in the table to recalculate the indicators.
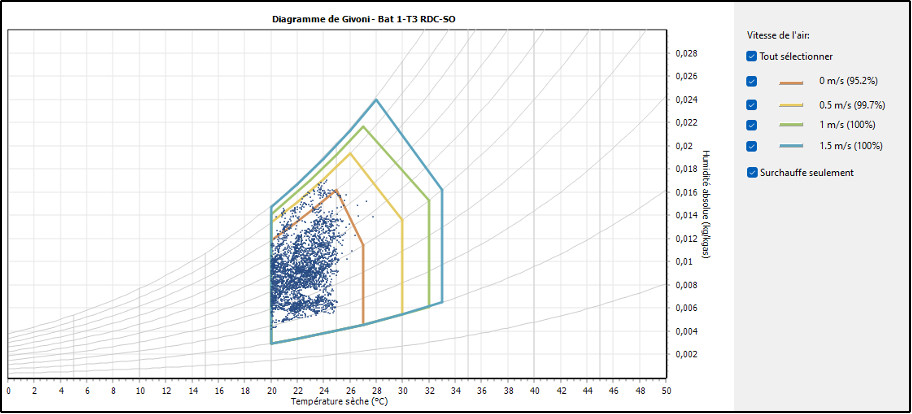
Givoni diagram
This visual shows the summer thermal comfort zones, taking into account temperature, air speed and humidity.
Because it is so clear and didactic, this diagram is a great success, particularly with project owners.
However, it does not take into account the specific reaction of each individual to a given thermal and hygrometric context. In addition, it does not take into account the gradual adaptation of the human body to temperatures, nor the dynamics of adaptation.
Adaptive comfort
Below are the limits of the zones defined according to the ambient category (in this case category II). Points outside these limits correspond to hours of discomfort. Here, all the points are below the upper limit.
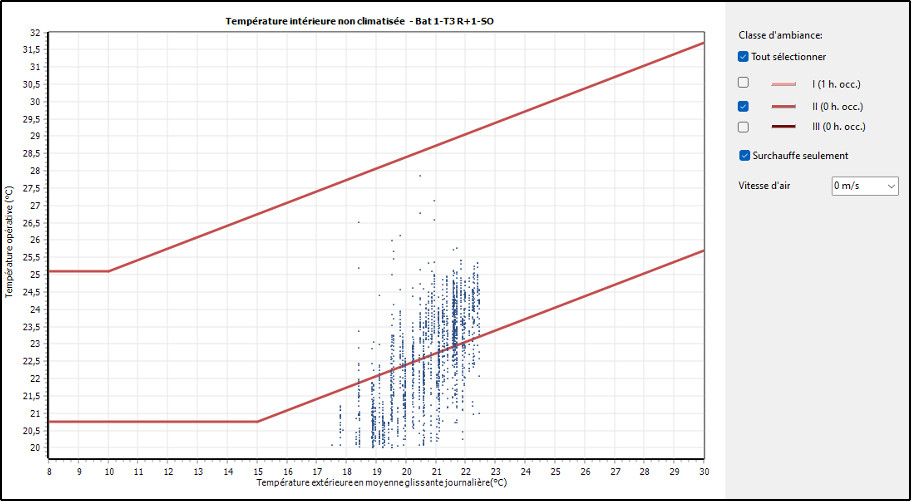
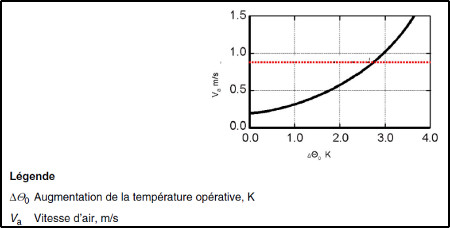
Under summer comfort conditions (indoor operating temperatures > 25 °C), and when there is air mixing, in accordance with the standard (adaptive comfort section), the upper limits of the graph below are increased by a few degrees.
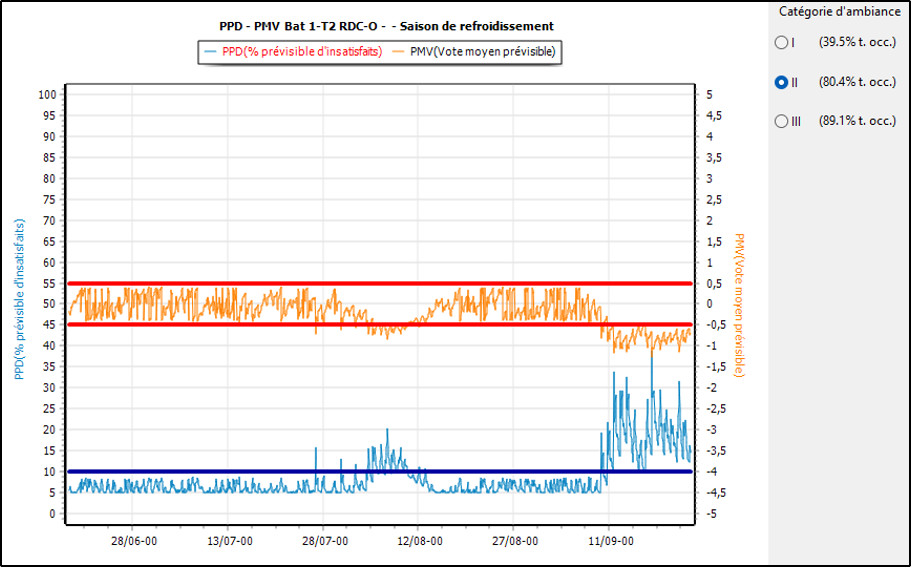
PMV/PPD
Summer PMV/PPD calculations apply exclusively to air-conditioned premises during the summer season (and to all heated premises in winter). These concepts for assessing thermal comfort are described in the article recommended in the introduction.
The PMV/PPD visual below corresponds to the air-conditioning period only. During this season, the blue limit of 10% dissatisfaction (left-hand scale) is practically never exceeded. It does not take into account any air velocity supplied by the fans.
DSimilarly, the red limits set for the average vote at 0.5 (right-hand scale) were hardly crossed during the period. As a reminder, +1 corresponds to “slightly hot”, -1 to “slightly cold”.
Coupling air conditioning and ceiling fans: integrating energy savings
When air conditioning and ceiling fans are combined, it is possible to estimate the savings in consumption using the SED, calculating consumption with systems.
So, in an initial simulation, the heating engineer will carry out a standard calculation with air conditioning. In a second calculation, he will include :
- increasing the air-conditioning set point (to 28°C, for example), taking into account the temperature gain associated with the use of ceiling fans. Use the diagram from the Woods Ventilation Guide as a guide (see our article on summer thermal comfort).
- Reducing the period of air conditioning, taking into account the impact of fans in mid-season.

STD with Pleaides: towards an even more effective tool?
Pleaides’ STD COMFIE module is rightly appreciated for dealing with summer comfort issues. It is based on recognised standards, shows important values (number of hours of discomfort), allows ceiling fans to be taken into account, and facilitates the bioclimatic design of the building, etc.
However, the story doesn’t end there, and we believe that improvements should be incorporated into future editions of the software to optimise the way ceiling fans are taken into account:
- incorporation of the European standard EN 16798, which replaces EN 15251 ;
- integration of the US standard ASHRAE 55-2020 ;
- as a corollary, a wider range of possible air speeds in summer;
- updating graphics, for example by drawing on the open-source work of the Centre for the Built Environment at the University of California, Berkeley (PMV and Adaptive Comfort).
- energy savings from winter destratification (almost 30% in high-rise premises).
In short, the use of STD to improve building design, particularly to cope with high summer temperatures, offers excellent prospects.
[i] Standard NF EN 15251 has now been replaced by standard NF EN 16798 (Energy performance of buildings).
It should be noted that these standards evolve less regularly than their US equivalent, l’ASHRAE 55-2020, which is considered the most relevant today.
We previously presented these two standards in the article “Summer thermal comfort and ceiling fans: can we quantify our experience?“
[ii] Supported by the French Environment and Energy Management Agency (ADEME), this research programme is being implemented by a consortium comprising Surya consultants, the project leader (design, research and development/thermal-energy-environment-modelling office); LASA (private acoustics laboratory); ISEA (independent soociologist); Laboratoire PIMENT – Université publique de la Réunion (housing and thermal engineering); Laboratoire Eiffel aérodynamique, a subsidiary of the CSTB group (aerodynamics-experimentation); EnvirobatBDM : (resource centre and Mediterranean sustainable building approach). This programme is a winner of the 2020 Responsible Buildings call for research projects.
[iii] The subject of layout is covered here : Ceiling fans: what are the layout rules?
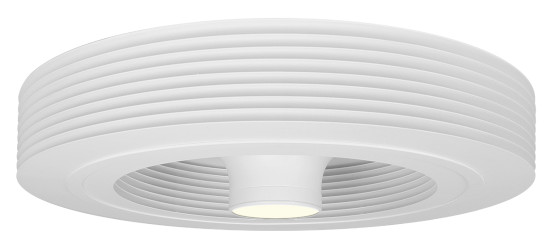
Exhale, the first vortex-effect ceiling fan without blades
Are you a professional? We have a dedicated area for you.
Find Exhale Fans Europe on Linkedin

